Predicting Stock Prices using Technical Analysis Trends
Please note: Technical Analysis is used in many different forms of investing such as commodities, futures, and currency trading. This hub solely focuses on the application of technical analysis to the stock market. Technical analysis isn’t exact, but it often gives a good indication of future stock prices based on logic.
What is Technical Analysis?
Technical analysis involves identifying trends and patterns within an asset’s price movement to predict if it will go up, down, or sideways. The market technician studies an asset’s graph and uses logical reasoning to forecast the actions of buyers and sellers and determine the direction and magnitude of price changes. Charles Dow, the namesake of the Dow Jones Industrial Average, was a market technician himself. Averages, however are technical indicators, and will not be covered in this hub. This hub focuses on the different trends and patterns that can be identified within the stock market. These patterns can take shape over any time horizon, whether it is days, weeks, months or years.
Resistance and Support Levels
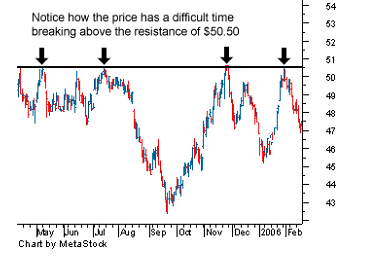
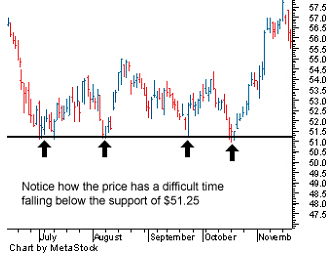
The resistance and support levels act as “ceilings” and “floors” for stock prices respectively. If the stock price breaks through a resistance or support the price will continue to go up or down continuously. Normally, a stock will bounce up and down between levels. This area of price fluctuation is known as the trading range, which can last for a few days or a few years. If a stock rises above the resistance level or below the support level this is known as a breakout.
Uptrends and Downtrends
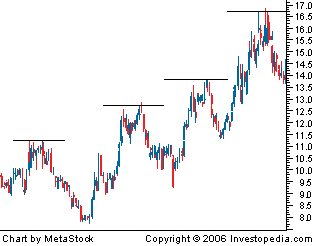
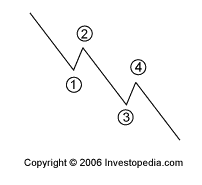
An uptrend is a series of rising bottoms, while a downtrend is a series of falling tops. The steeper the slope of the uptrend, the quicker it will end. Stocks will either move up, down, or sideways. If the stock is trading sideways and the trend lines are parallel, buy close to the support level and sell as close to the resistance level as possible. There will likely be a large upswing or downswing after the market is sideways.
Tops and Bottoms
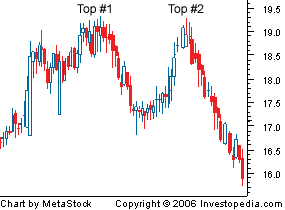
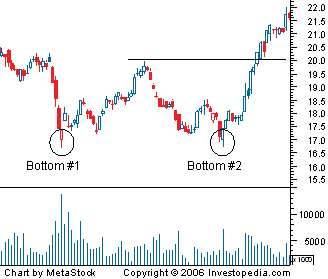
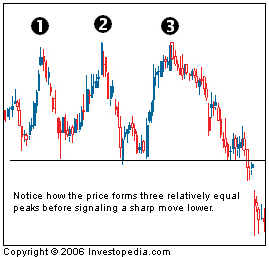
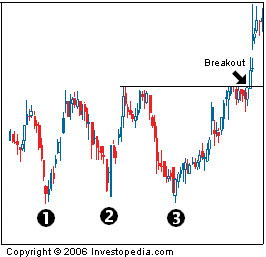
A double top, or twin peak, is formed when a stock hits the resistance level twice and shoots downward. A double bottom, or double valley, is exactly the opposite with prices rising after the support level is touched for the second time. The two tops and bottoms do not have to be exactly the same, but they are usually very close. In a double top, investors see that a previous high was reached for a second time and decide it is a good time to sell, this causes the price to drop indefinitely. The opposite is true of the double bottom scenario. There are also triple tops and triple bottoms that act the same way as their double counterparts.
Head and Shoulders
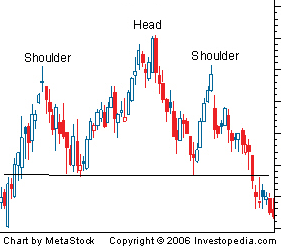
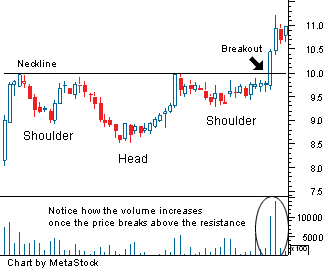
A head and shoulders pattern consists of one high peak and two lower peaks on each side, thus resembling the outline of a person’s head and shoulders. It is somewhat like a triple top in appearance and they both signal bad news for any investor holding the stock. The stock makes the second shoulder because there isn’t enough momentum to reach the previous high. The second shoulder breaks through the support line and continues downward. The distance the stock moves downward is approximately equal to the height of the peak. The inverse head and shoulders is the opposite. It is a reflection of a regular head and shoulders, and is very good news for investors.
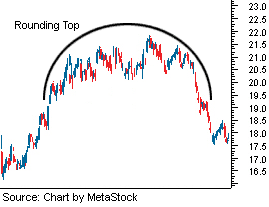
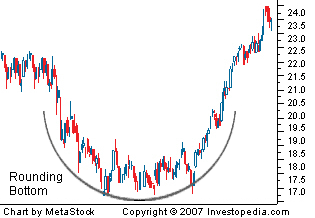
Rounding Tops and Bottoms
A rounding top is an uptrend that gradually turns into a downtrend. The height of the rounding top is known as the distribution phase. During the distribution phase, investors holding the stock sell high to optimistic buyers. This dumping of shares is what causes the downtrend. A rounding bottom begins with a downtrend which bottoms out in the acquisition phase and becomes an uptrend. The acquisition phase is when savvy buyers recognize a recovery is around the corner and buy from unsuspecting sellers. There was definitely an acquisition phase in early March of this year. Be careful when buying on a downtrend to only buy when an uptrend is beginning, or else there may be eminent losses as the stock price continues to drop. Also note that rounding tops and bottoms are usually not perfectly round, they are often jagged and bumpy.
Triangles
Symmetrical Triangle
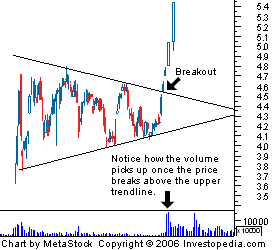
A simultaneous uptrend and downtrend create a symmetrical triangle. This triangle can break out in either direction. The stock price must break out before it reaches the point of the triangle or there is no effect. The amount the price increases is equal to the initial height of the triangle. The volume traded must also be increasing for there to be a break out to the upside. If volume is steady, it is likely the stock will fall to the downside.
Pennant
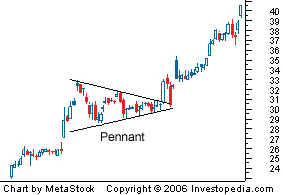
The pennant is similar to the symmetrical triangle except it is somewhat easier to predict. There will be a certain dominant trend occurring before the pennant is formed; the price will be going either up or down noticeably. Whatever direction the price is going before the pennant is formed will be the same direction the price is going after it exits the pennant.
Ascending and Descending Triangles
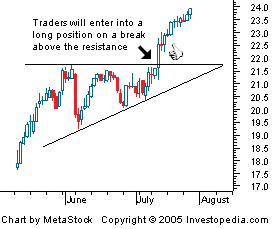
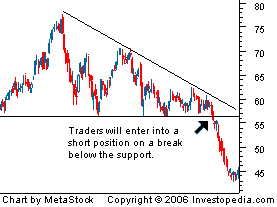
The ascending triangle is a combination of an uptrend and a resistance level. This formation is almost always a bullish sign, but it can break out to the downside. Like the symmetrical triangle, the price increase is equal to the initial height of the triangle. The descending triangle is exactly the opposite; it is a bearish sign. The price decrease in price will be equal to the height of the triangle.
Flags
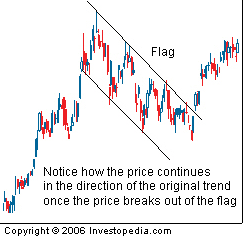
A flag occurs when an uptrend or downtrend becomes trapped between parallel support and resistance lines and then breaks out in the same direction of its initial movement. Flags usually appear to be moving in the opposite direction of the overall trend. They occur as prices face adversity from buyers and sellers as prices rise and fall. This “adversity” causes the actual trend to waiver momentarily before continuing on the same path.
Wedges
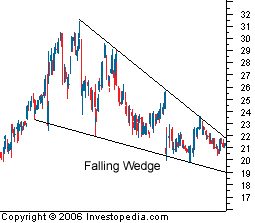
A wedge is similar to a flag except the resistance and support lines eventually converge. The price eventually moves toward the flatter of the two trend lines. A rising wedge is a sign of a bullish market, while a falling wedge is considered bearish.
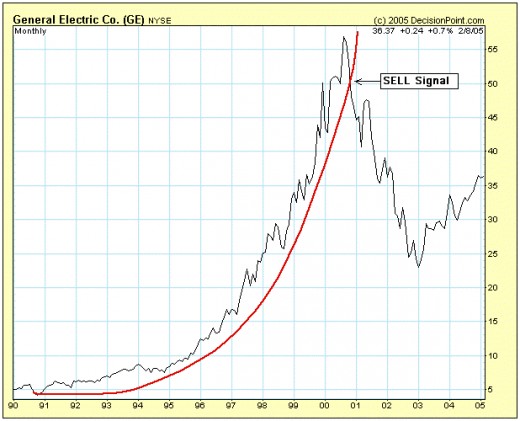
Parabolic Curve
Parabolic curves are steep inclines in stock prices caused by intense speculation. This type of movement should be avoided as the stock price normally falls hard after these large upward gains. These types of curves are normally seen in highly volatile stocks which fluctuate very erratically. Low volatile stocks that have nearly a “flat line” formation should be avoided as well, since there is a low capital gain potential.
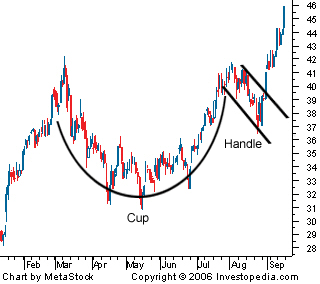
Cup and Handle
The cup and handle is a pattern formed by a rounded bottom followed by a flag, which resembles a coffee mug. The stock will reach an initial high point and decrease until it reaches a new high again where it faces sell off pressure. This will create a flag formation until eventual break out. If the bottom of the cup has a strong U-shape, then the pattern should be taken into consideration as a bullish indicator. The trend does not apply if the cup bottom is a V-shape.
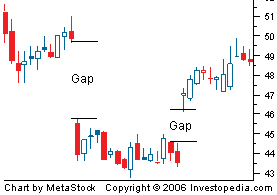
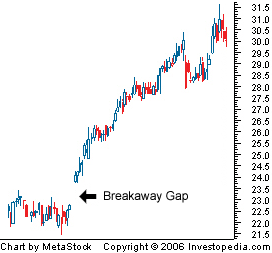
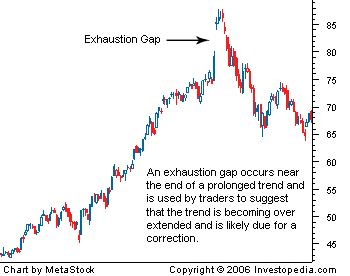
Gaps
Gaps occur when there is a dramatic change in stock price, and the chart shows an actual gap in the movement. Gaps can be upward or downward. The upward gap, or breakaway gap, needs high trading volume to occur. These positive gaps usually occur when there are significant events for the company, or if positive earnings reports are released. Breakaway gaps can mean big capital gains for investors. Downward gaps, sometimes called exhaustion gaps, signal a downward spike in stock prices. Downward gaps may be a result of undesirable company headlines. An exhaustion gap can be a good signal for investors to exit positions as losses are extensive and typically last for a while.
(Note: Gaps can only be seen if the chart is in some type of candlestick format, such as the charts shown in this hub.)
All of the charts used here came from Investopedia.com. http://www.investopedia.com
Quick Guide to Technical Analysis Trends and Price Direction
Trend or Pattern
| Price Direction
|
|---|---|
Resistance (breakout)
| Up
|
Resistance (reflection)
| Down
|
Support (breakout)
| Down
|
Support (reflection)
| Up
|
Uptrend
| Up
|
Downtrend
| Down
|
Sideways
| Up or Down (dramatically)
|
Double (or Triple) Top
| Down
|
Double (or Triple) Bottom
| Up
|
Head and Shoulders
| Down
|
Inverse Head and Shoulders
| Up
|
Rounding Top
| Down
|
Rounding Bottom
| Up
|
Symmetrical Triangle (with High Volume)
| Up
|
Symmetrical Triangle (with Low or Steady)
| Down
|
Pennant (after Uptrend)
| Up
|
Pennant (after Downtrend)
| Down
|
Ascending Triangle
| Up
|
Descending Triangle
| Down
|
Flag (after Uptrend)
| Up
|
Flag (after Downtrend)
| Down
|
Rising Wedge
| Up
|
Falling Wedge
| Down
|
Parabolic Curve
| Up (dramatically)
|
Cup and Handle
| Up
|
Breakaway Gap
| Up (dramatically)
|
Exhaustion Gap
| Down (dramatically)
|


